Overview
WIRO Spec is the second of a new generation of facility instruments developed for the Wyoming Infrared Observatory (WIRO). The spectrograph was designed by Michael Pierce, Harold Nations and Philip Haynes. Our primary goal was to provide a high-efficiency medium-resolution spectrograph for the WIRO 2.3-meter telescope at low cost. Steve Hodder was the primary machinist for the project and James Weger developed the electronic design. The instrument is bench-mounted and located within a freezer located near the south pier of the telescope. The design features Volume-Phase-Holographic (VPH) Gratings enabling a total system efficiency of almost 50%. The optical design features all-transimission optics with a 345 mm f/3.5 collimator and a 109 mm f/1.8 camera mounted on an articulated stage. The VPH transmission grating is located within these two components and can be rotated to "scan" in wavelength. With these optics the 100 um fibers of the 15x20 fiber integral-field unit project to 2.3 pixels with the Marconni/EEV CCD camera (13.5 microns/pixel). The all-transmission design was adopted in order to enable a short collimated beam. This was necessary to ensure that a long slit (i.e. lots of fibers) would suffer from little, if any, vignetting losses. A positive meniscus field lens is located immediately behind the "slit" to create a geometric pupil at/near the entrance aperture of the spectrograph camera since this is the element with the smallest aperture and the most sensitive to vignetting. The spectrograph is operated in a Littrow configuration since this is the condition of maximum efficiency for VPH gratings. In this case the grating equation becomes:
nu lambda = 2sin(theta),
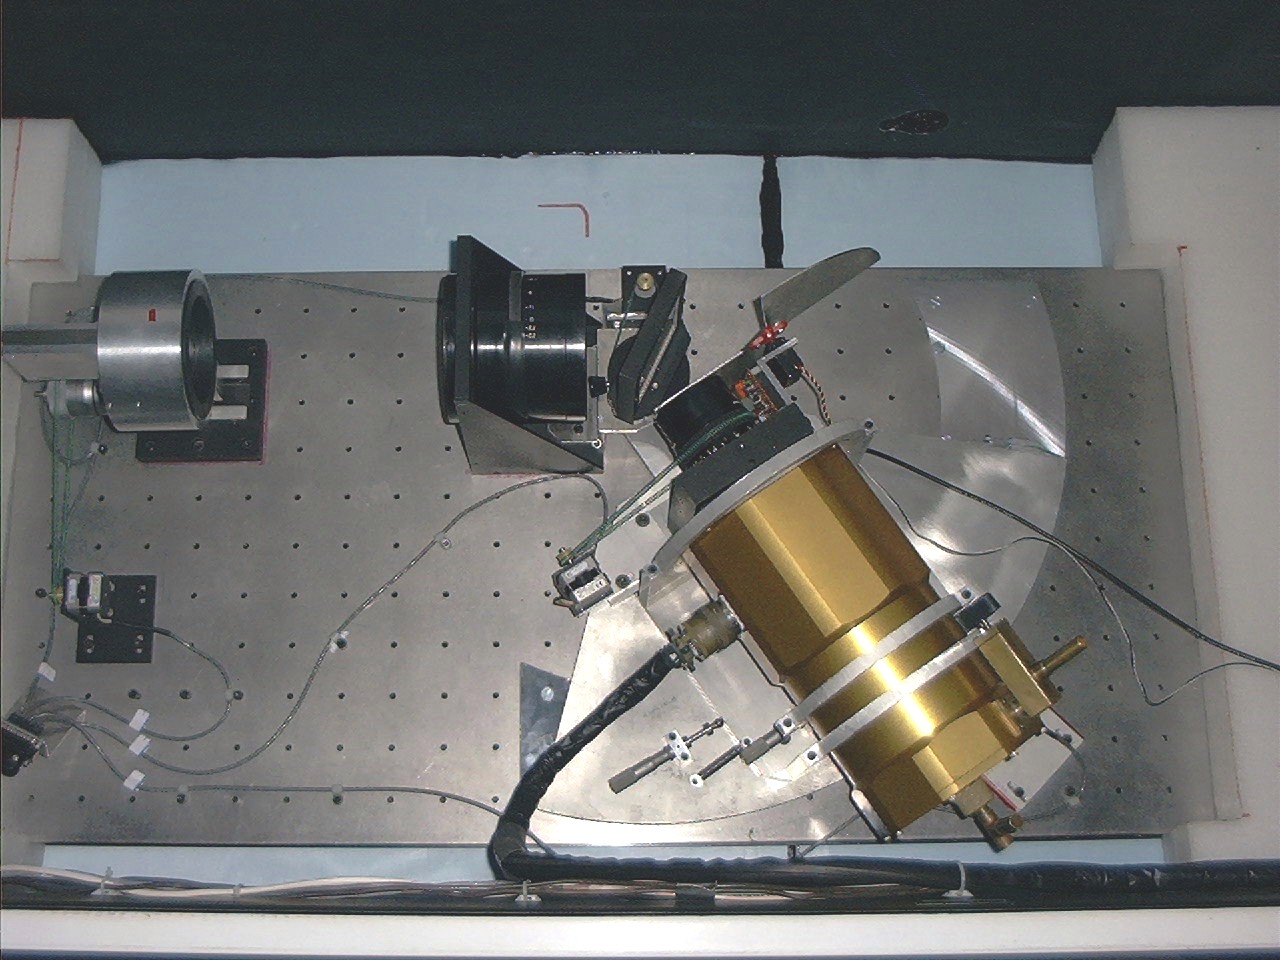
where nu is the line frequency (lines/nm) and theta is the incident angle for the grating. Note that the Littrow condition requires that the camera-collimator angle be twice the incident angle for the grating (theta). Thus, the incident angle for the grating can be computed for any desired wavelength and the camera-colimator angle follows. See the top view in the figure above.
The telescope is positioned in order to place a target onto a fiber-optic integral-field unit. This assembly consists of 293 optical fibers glued into a hexagonally-packed array of 15x20 fibers each of which projects to 1 arcsec diameter on the sky (see figure below). The fiber-optic cable leads to the bench-mounted spectrograph located on the observatory floor. At the spectrograph the 293 fibers are formed into a vertical stack to form a "slit". The spectrograph optics ensure that the slit is imaged onto the 2048x2048 detector such that the 293 spectra can be recorded simultaneously. Once the spectra are individually wavelength calibrated the user can measure velocities, line-ratios, etc., at any point in the object given the X-Y position of each fiber in the integral-field array. At present one fiber is broken (#155) is is hence unusable. Luckily it is located on the edge of the array and so its impact is negligible.
Guider Acquisition Assembly (GAM)
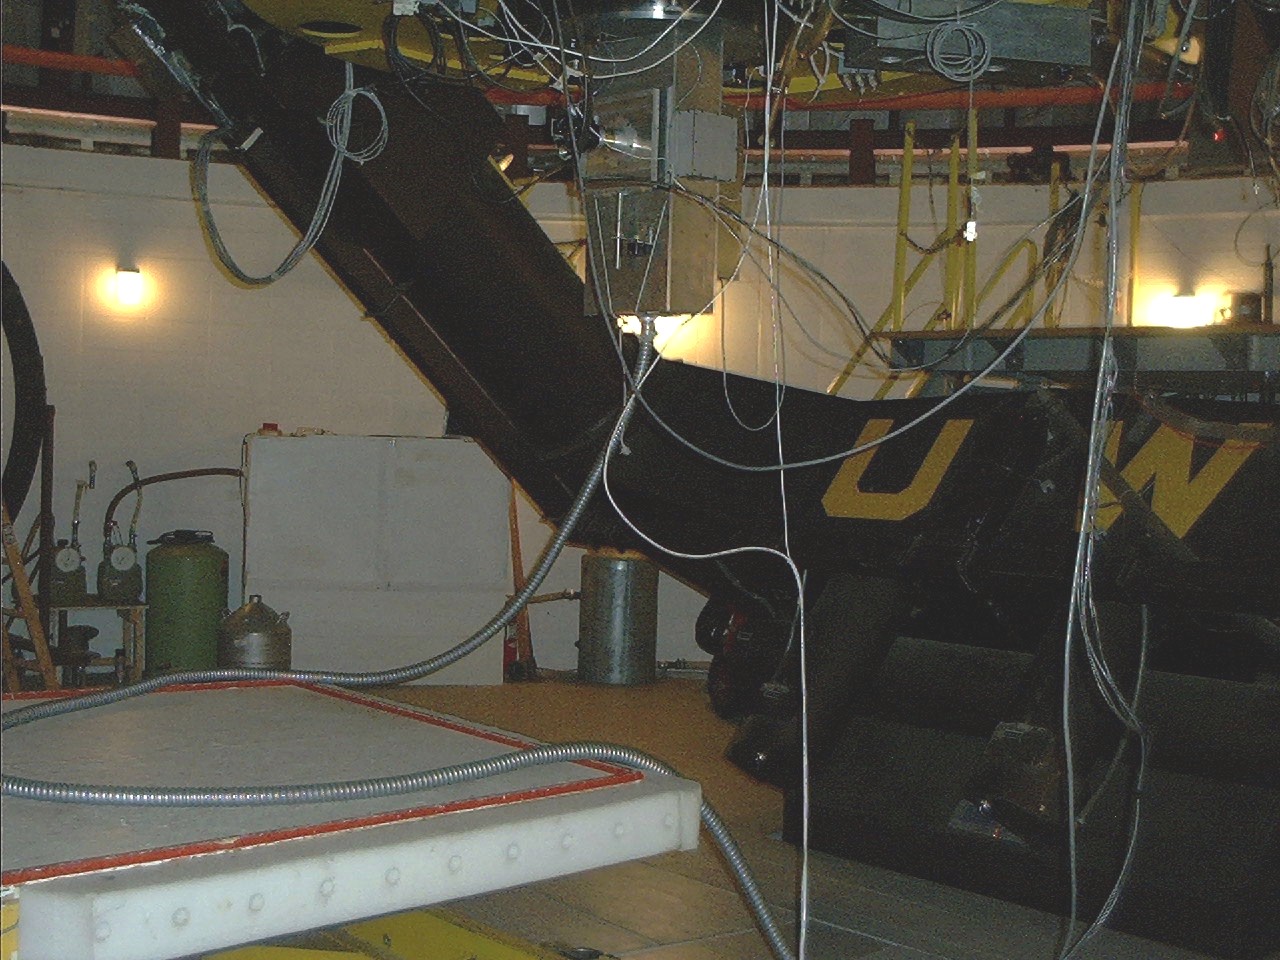
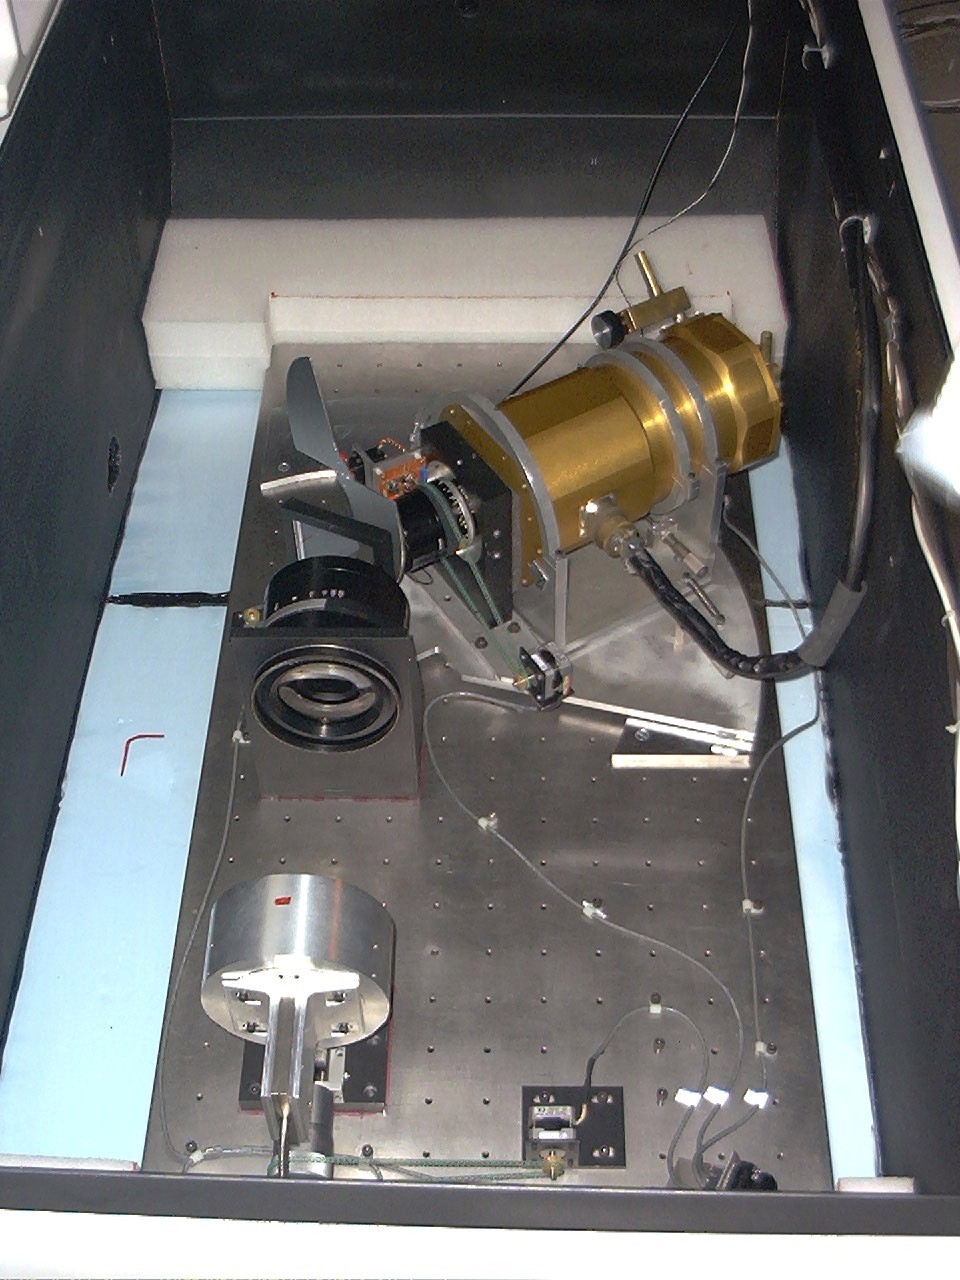
The Guider Acquisition Assembly (GAM) is located at the Cassegrain focus of WIRO and contains the integral-field, fiber optic array, a small ST-237 CCD for guiding and object acquision, and the calibration lamps for the spectrograph. Since the Cassegrain focus of WIRO is f/27, this assembly also contains 0.33X focal reducing optics in order to produce an f/9 beam such that the image scale is better matched to the size of the optical fibers (see below). The figure below shows the GAM mounted on the WIRO telescope. Note the flexible steel conduit containing the fiber-optic cable extending from the bottom of the GAM. The coil visible on the observing platform provides extra slack in the cable in order to allow the telescope to be positioned to any point on the sky without undo stress on the fibers. A more detailed description of the GAM and its use can be found here.
Integral Field Unit (IFU)
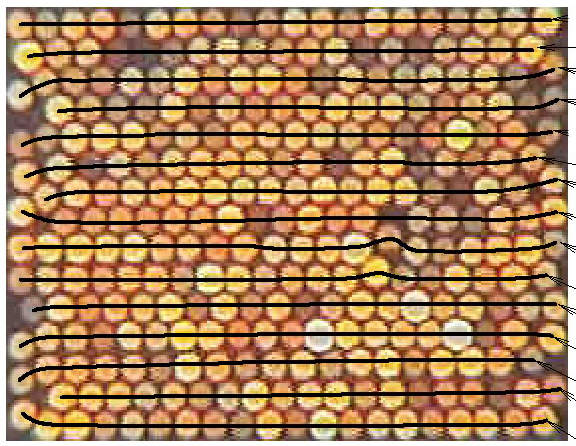
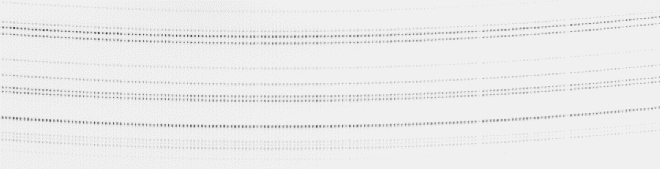
The integral field unit (IFU) of WIRO-Spec is comprised of a rectangular array of hexagonally-packed optical fibers. Each 100 mm fiber subtends 1.0 arcsec when mounted behind the 0.33x focal reducer at the Cassegrain focus of WIRO. This size was chosen as a compromise driven primarily by the 13.5 mm pixels of the EEV/Marconi CCD and the desire to minimize vignetting losses due to the focal ratio degredation from the fibers (see Design Considerations ). The 293 fibers are arranged into a "15 X 20" array with alternating rows of 20 and 19 fibers. In order to keep the costs of the IFU low, no attempt was made to map adjacent fibers in the IFU onto adjacent positions along the slit. The IFU was manufactured by InnovaQuartz in Phoenix, AZ by gluing each row of fibers into the IFU assembly. The hexagonally packing of the 120 mm fibers (including the cladding and buffer), results in a 70% packing fraction for the IFU. At the slit end the fibers were glued into a slit of 75 mm length on 250 mm centers. This spacing was chosen as a compromise between the need for clean separation of the individual fiber traces on the CCD and the desire to have as many fibers in the IFU as possible. The figure below shows the back-lit array and a table of x-y positions vs. slit position (necessary for the analysis) can be found here. At the present time one fiber located on the edge of the IFU is broken (#155). The right hand figure below shows a portion of and exposure of a Xe calibration lamp which shows the individual emission lines from each fiber.
Further details of the optical design considerations are described here.
Mechanical Design
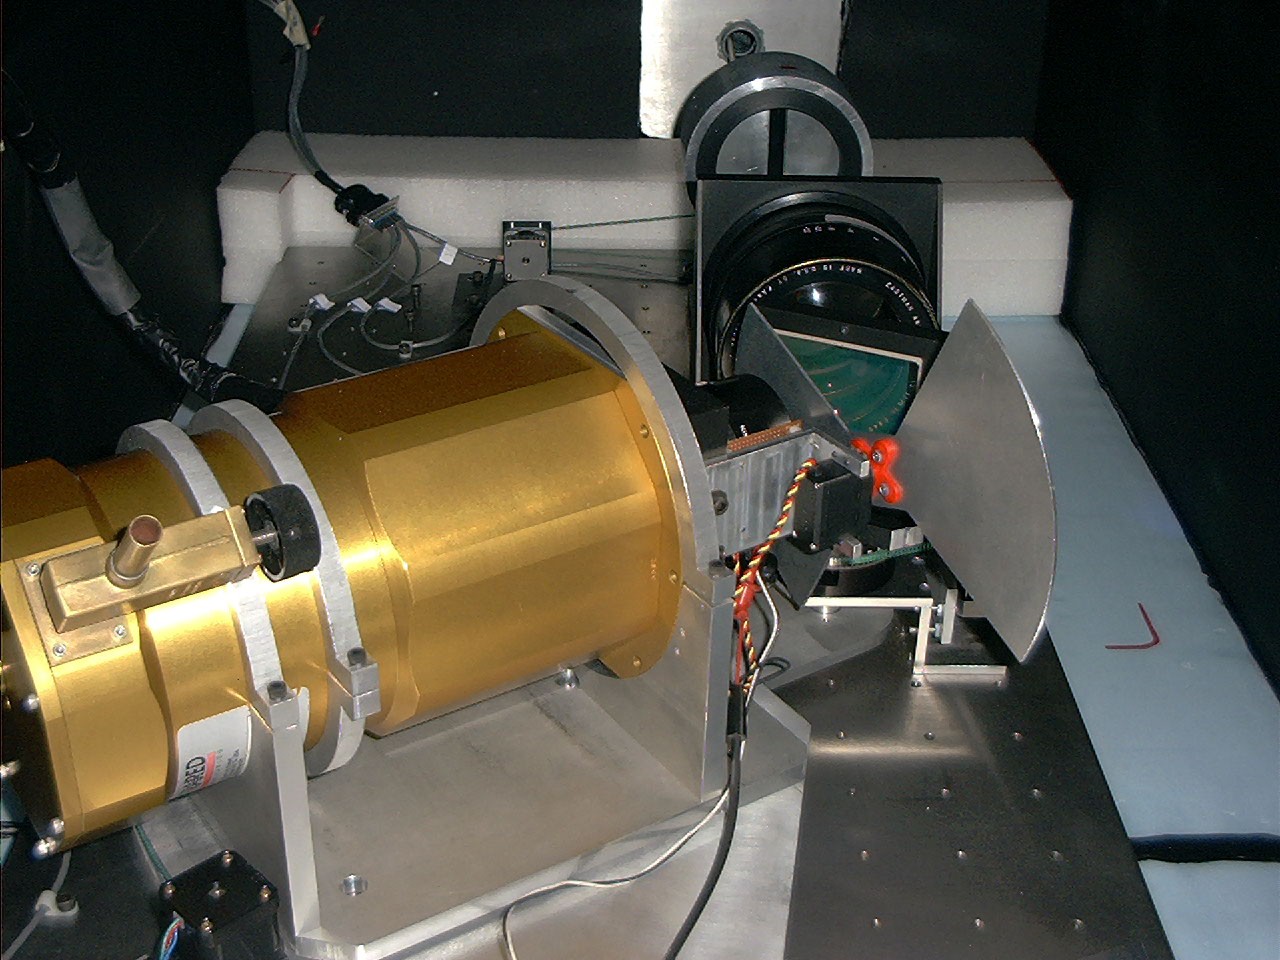
The 293 fibers result in a long slit and hence a large off-axis angle as seen by the collimator and camera. The need to minimize vignetting vs. slit position and as a function of wavelength requires a small collimated beam length. Our design features an articulated camera consiting of a large, 48-deg sector, 17-inches in radius. This allows the spectrograph to be configured over a broad range of wavelengths. An "imaging mode" can be configured by placing the grating and camera-collimator angles at 0-deg. This configuration is provided primarily for engineering tests but it may prove useful for confirming target acquistion as well.
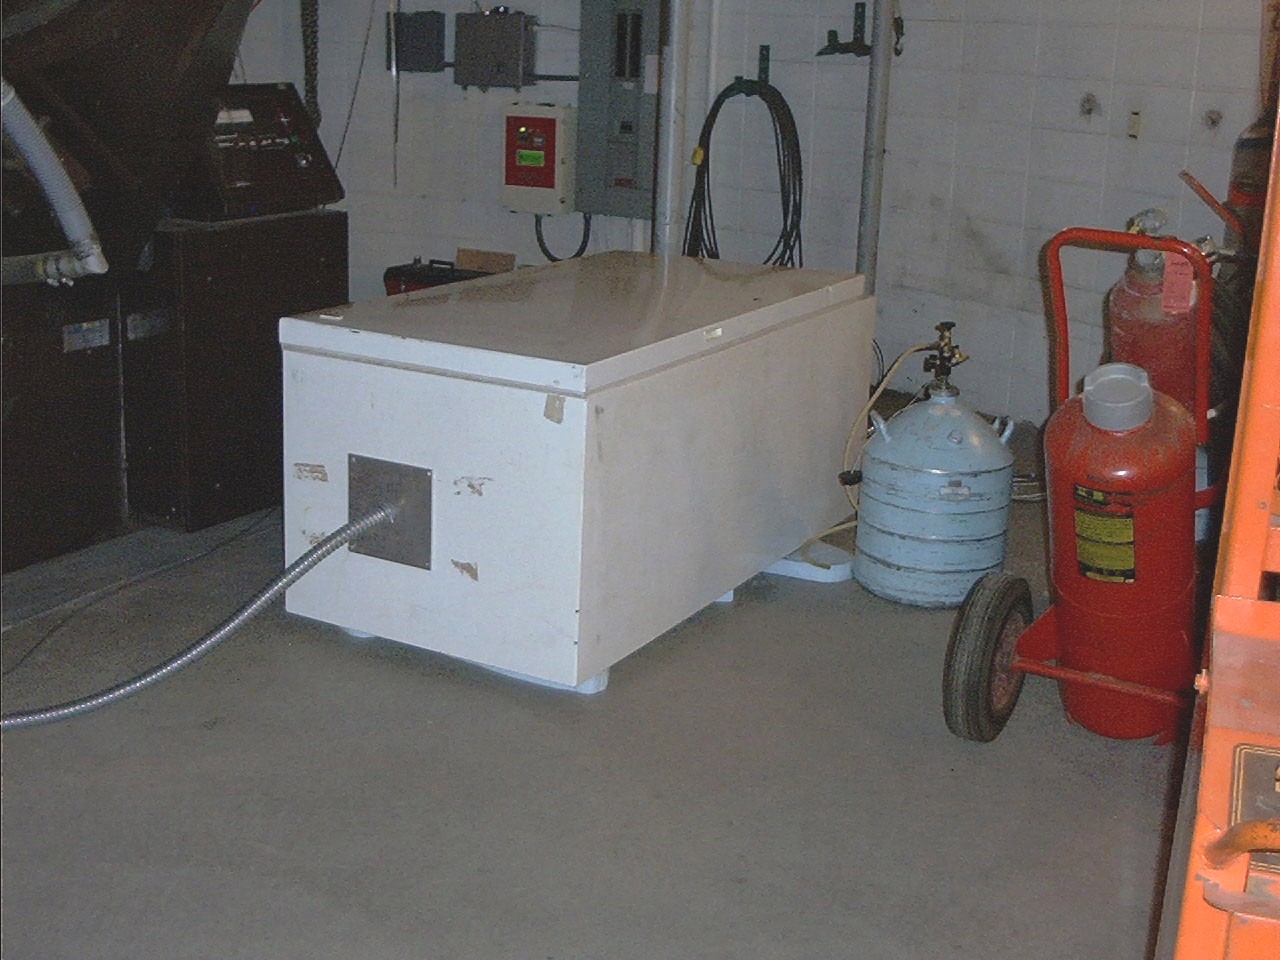
WIRO-Spec is designed to be fully stepper-motor controlled. This requires 2 stepper motors to control the camera and collimator focus and 2 more to control the grating rotation stage and the camera-collimator angle. An additional stepper motor is used to control the position angle of the IFU making a total of 5 motors on the spectrograph. The instruemnt is mounted on styrofoam pads within an old freezer. This provides a cheap, insulated, light-tight box and support for the optical bench assembly. The figures below show the spectrograph and the freezer on the observatory floor next to the south pier of the telescope. Note the steel conduit used to protect the fiber optic cable.
Available Gratings
Two VPH gratings were kindly provided by Richard Rallison of
Ralcon Inc.
The characteristics of the two gratings are given in the table
below. We are currently in the process of acquiring an additional VPH
grating optimized for the blue portion of the spectrum.
|
|
|
|
|
Efficiency |
|
| Ralcon-1 | 1435 l/mm | 6500 A | 28-deg | 85% | H-alpha |
| Ralcon-2 | 985 l/mm | 8500 A | 25-deg | 85% | Ca II Triplet |
Instrument Control Interface
The graphical user interface (GUI) was designed and programed under Visual Basic 6 by M. Pierce and P. Haynes. The interface communicates over ethernet to a Compumotor 6K8 stepper motor controller, allowing the user to select the desired wavelength and focus the camera and collimator. The figure below shows the WIRO-Spec GUI.
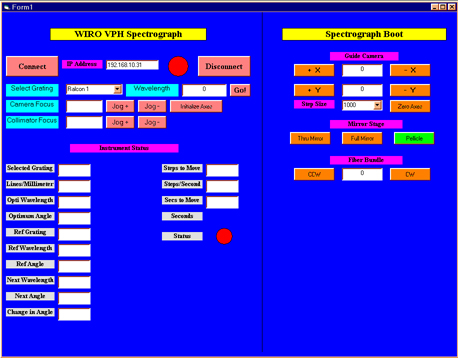
The GUI controls both the spectrograph configuration and the Guiding and Acquision Module (GAM). The right side of the GUI is assocated with the GAM and the left side is assocated with the spectrograph. The uppermost text box of the spectrograph control shows the IP address of the 6K8 controller and the two buttons immediately underneath allow the user to connect/disconnect to/from the 6K8. The spectrograph GUI allows the user to select the currently mounted grating from a pull-down menu. The desired wavelength can then be entered into the text box. The corresponding grating and camera-collimator angles are computed using the grating equation. The spectrograph components are then configured by pressing the go button. The software will then ask the user to verify that the spectrograph clamps are released before the components are positioned. The starting and desired wavelengths as well as the grating and camera angles are displayed in the text boxes and the components begin to move. The button at lower right will turn green once the spectrograph components are corectly positioned. Finally, the software computes the position angle of best focus for the CCD dewer relative to the camera in order to allow for the small focus variations with wavelength present in typical camera optics. At the present time the user must set the micrometer to the computed postion manually in order to achieve the optimum focus. Once the components are positioned, the camera focus can be adjusted via the jog buttons. Note that the spectrograph camera focus is very sensitive to temperature variations and it should be checked at the beginning of each night using the calibration lamps. It is expected that the collimator focus will rarely have to be changed.
Measured Performance
Measurements of the individual components of the spectrograph imply that the overall system throughtput should be about 40%. However, on-sky measurements of spectrophotometric standards indicate that the efficiency is actually only 15%. The discrepancy has been traced to a larger focal-ratio degredation than expected. That is, the ouput beam from the fibers forming the slit is faster than expected and light is lost at the collimator. We are currently investigating the possibility of using an array of micro-lenses to improve the situation. Stay tuned for updates. Some spectral images and extracted spectra can be found at the links given below.
Guiding and Acquisition Module (GAM)
Last Modified 12/10/2002 by Michael Pierce (mpierce@uwyo.edu)