|
1
|
- This week: Large
Scale Structure
- (Ch. 11, Combes et al., parts)
- Unless noted, all figs from
Combes et al.
- Already talked about galaxy clusters a lot, and some distance ladder
topics will be covered in more detail in Mike Pierce’s class next
semester.
|
|
2
|
- Discuss homework
- Not as great as expected – just busier now? Can turn in problem 6 next week
for extra credit – please write up the process!
- Discuss Observing Project (briefly!)
- Mid-term exam:
- 2 hours, take-home, on your honor, only calculator and
constants/conversions
- Some “basic knowledge” questions in addition to more
analytic problems. Know
terms, definitions, other intangible issues.
|
|
3
|
- Galaxy structure – how is the mass in the universe distributed
(and recall gas can be important, too!)? Homogeneous? On what scale?
- Text is a bit old (fine for history), but the best newest information
will come from SDSS and 2dF.
CHECK IT OUT!
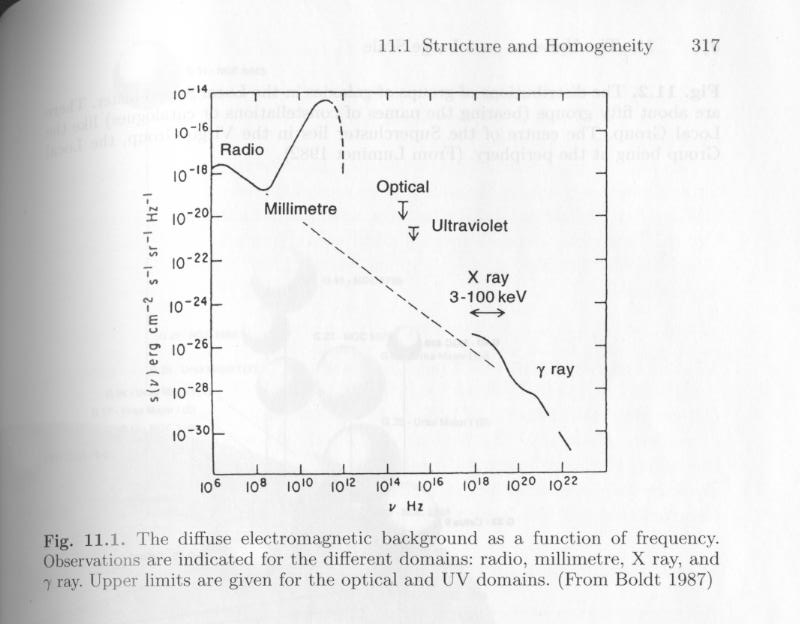
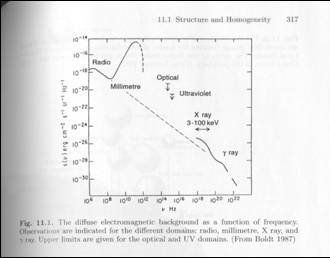
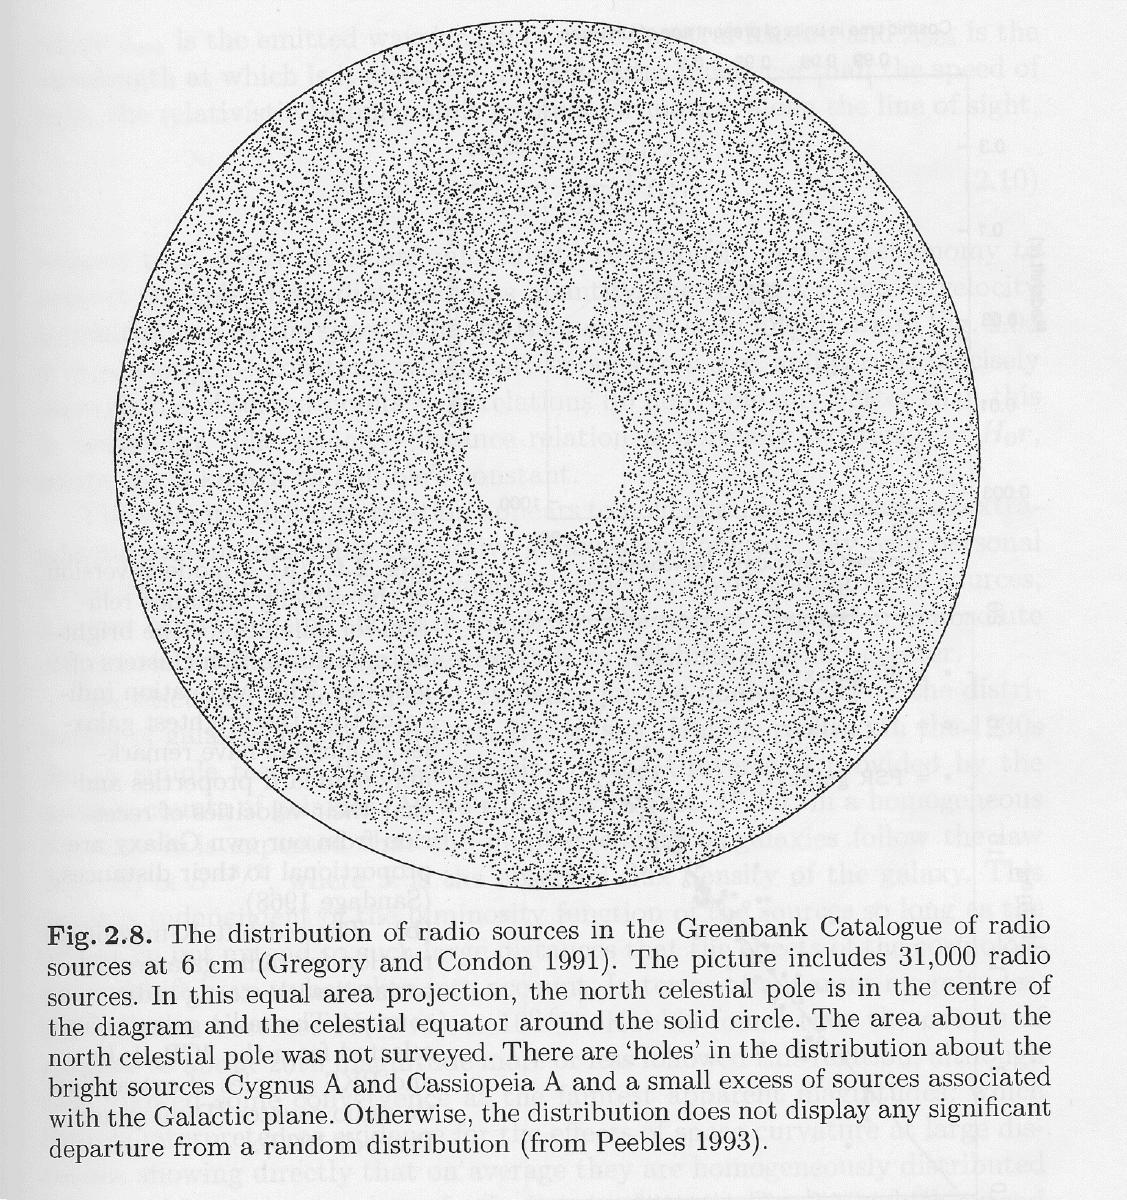
- Background radiation also of interest (discrete sources vs. true diffuse
background).
|
|
4
|
- CMBR of special interest (as we will get to) and X-ray is a recent
development (CXO).
|
|
5
|
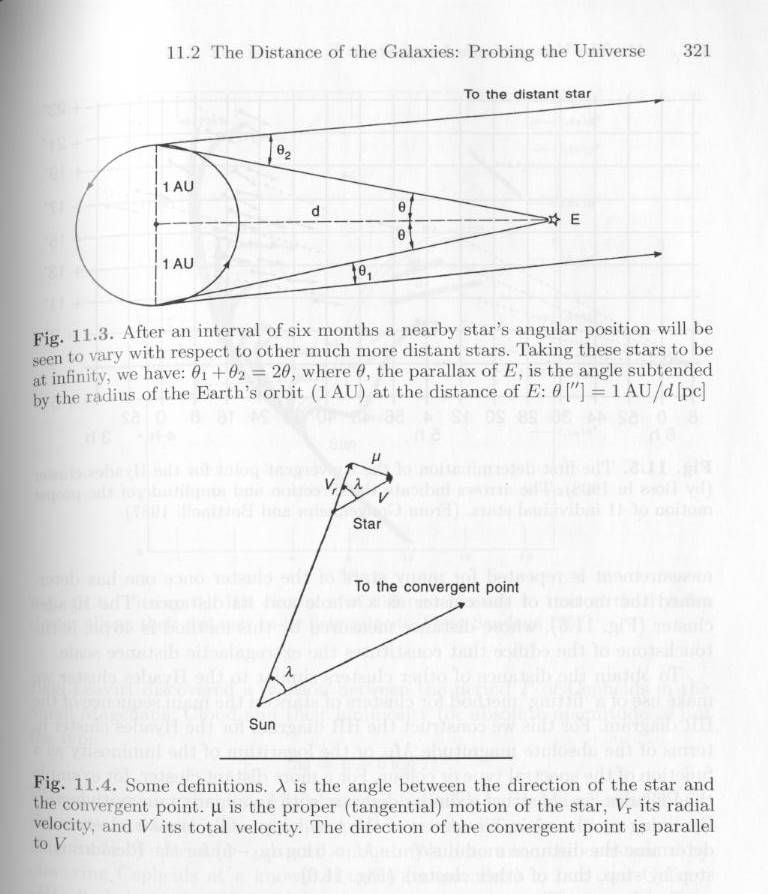
- Parallax and Trigonometric Methods:
|
|
6
|
- Parallax and Trigonometric Methods
|
|
7
|
- Parallax and Trigonometric Methods
- tan λ = Vt/Vr = μd/Vr
- So then d = Vr tanλ/4.74μ [pc]
- Where velocities are in km/s and proper motion μ is in arcseconds
per year.
- Should be something you can derive (it would be a good problem to work
in your free time)
|
|
8
|
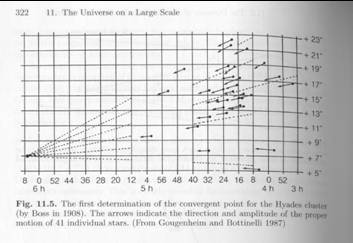
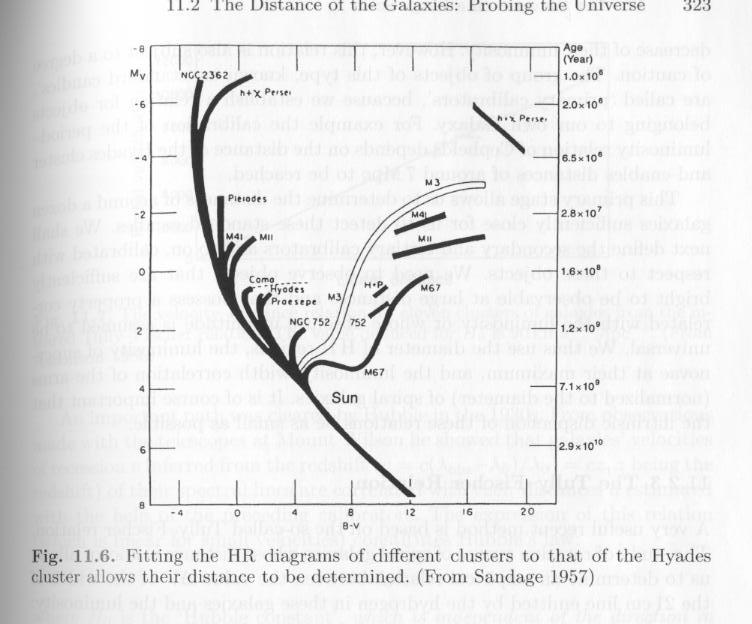
- Parallax and Trigonometric Methods – once Hyades distance known,
can use main-sequence cluster fitting.
|
|
9
|
- Parallax and Trigonometric Methods – once Hyades distance known,
can use main-sequence cluster fitting.
- Then employ the distance modulus, basically a vertical shift on the CMD
diagram, (m-M = 5 logd(pc) -5)
|
|
10
|
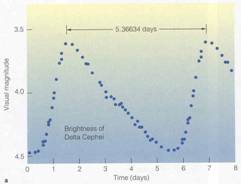
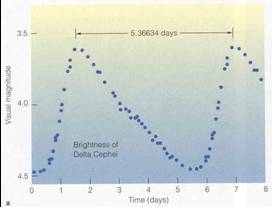
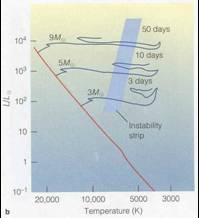
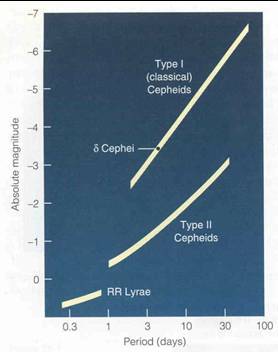
- Cepheids and Standard Candles
- Various stars in the instability strip of the H-R diagram with
Period-luminosity relations.
|
|
11
|
- Cepheids and Standard Candles
- Various stars in the instability strip of the H-R diagram with
Period-luminosity relations.
- Figures for Cepheids from Horizons (Michael Seeds)
|
|
12
|
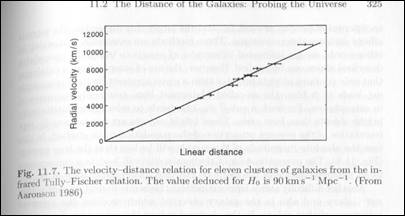
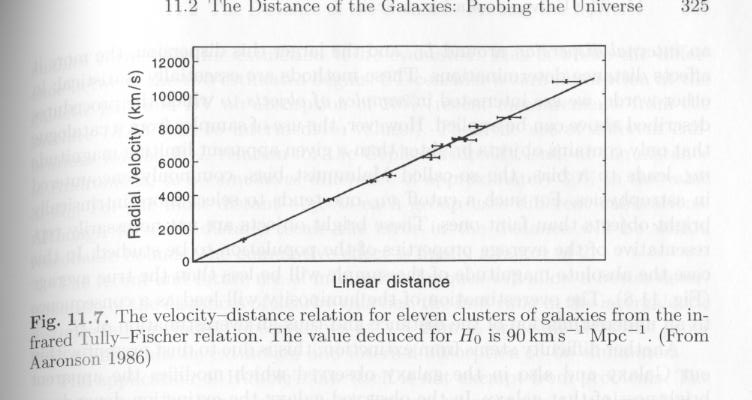
- The Tully-Fischer Relation
- L = kΔVα – where the index is ~ 4.
- Better in the near-IR, as we discussed before, less star formation
visible at H-band, so less distortion.
- The velocity dispersion comes from either 21 cm or stellar optical
absorption lines.
|
|
13
|
- This is where Combes et al. discusses the Hubble Law:
- Vr = Hod where Ho is in km/s/Mpc
- Hubble constant Ho is independent of direction in the sky (that’s
important, think about it!)
- Also recall Ho = h 100 km/s/Mpc
|
|
14
|
- The Tully-Fischer Relation
|
|
15
|
|
|
16
|
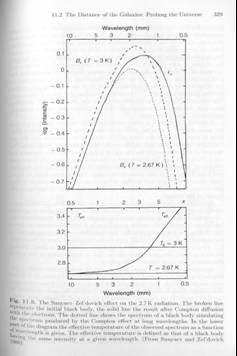
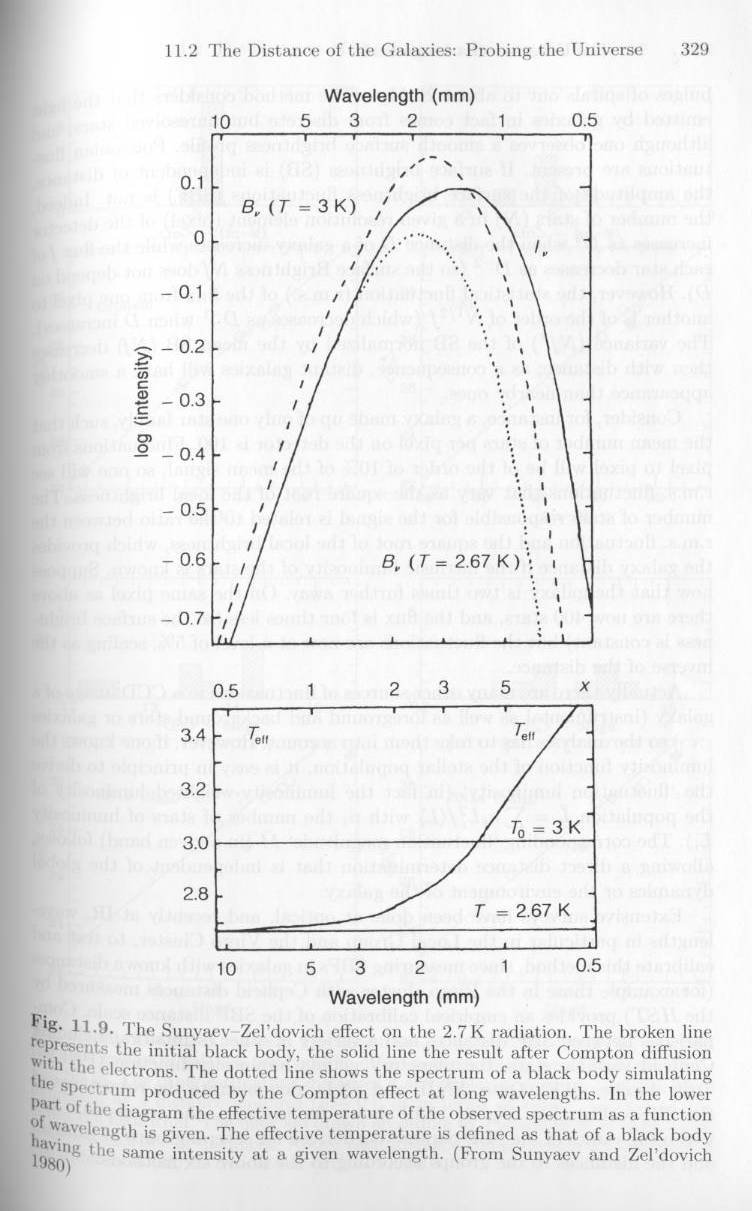
- The Sunyaev-Zeldovich Effect:
- Look toward hot intercluster medium in galaxy clusters…Thomson
scattering can affect the CMBR seen through such a medium
- Optical thickness is τT = ∫σTne
dl
- Cluster properties can indeed “hamper” the CMBR
- The CMBR is heated by the ICM, altering the frequency: Δν/ν
= 4kTe/mec2, leading to:
- ΔT/T = - ∫ 2kTe/mec2 dτT
(hν << kTe)
- At low frequencies, REDUCES the temperature of the CMBR.
- Can get distance estimates from S-Z effect.
|
|
17
|
- The Sunyaev-Zeldovich Effect
- Measure the X-ray flux, the temperature fluctuations, and the
temperature, and can get distance, and hence Ho.
- Compton effect here
|
|
18
|
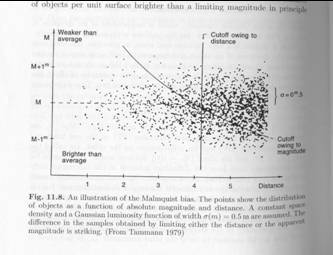
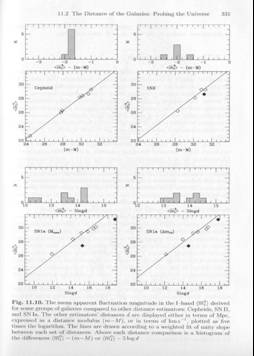
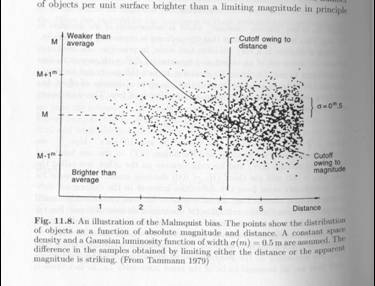
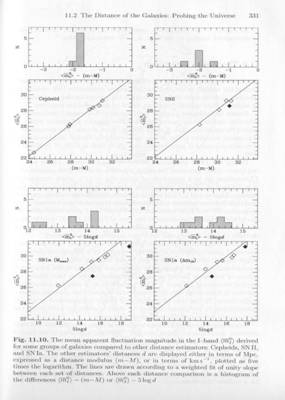
- Surface-Brightness Fluctuations
- Surface brightness does not vary with distance – why?
- How about, say, the number of stars per pixel as a function of
distance? That does change,
and the statistical uncertainty does vary with distance.
|
|
19
|
- Surface-Brightness Fluctuations
|
|
20
|
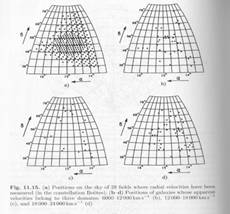
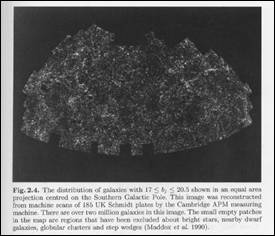
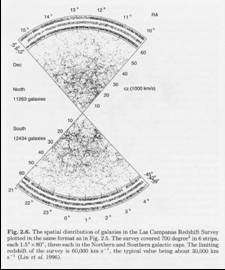
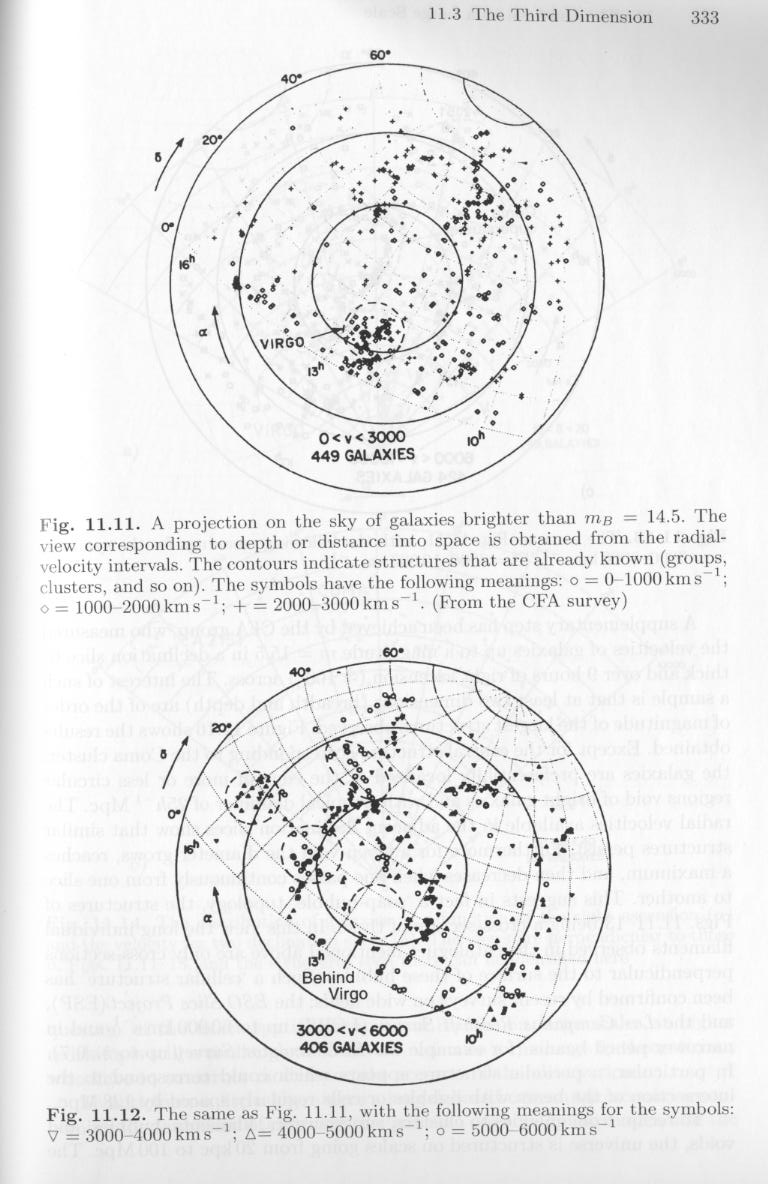
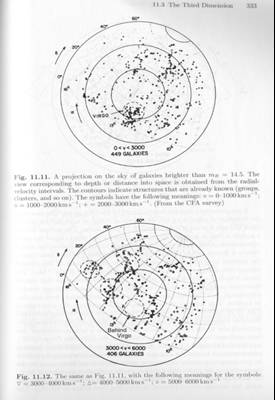
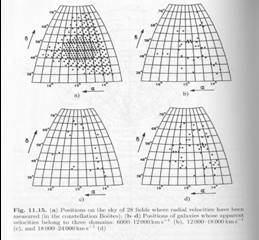
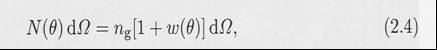
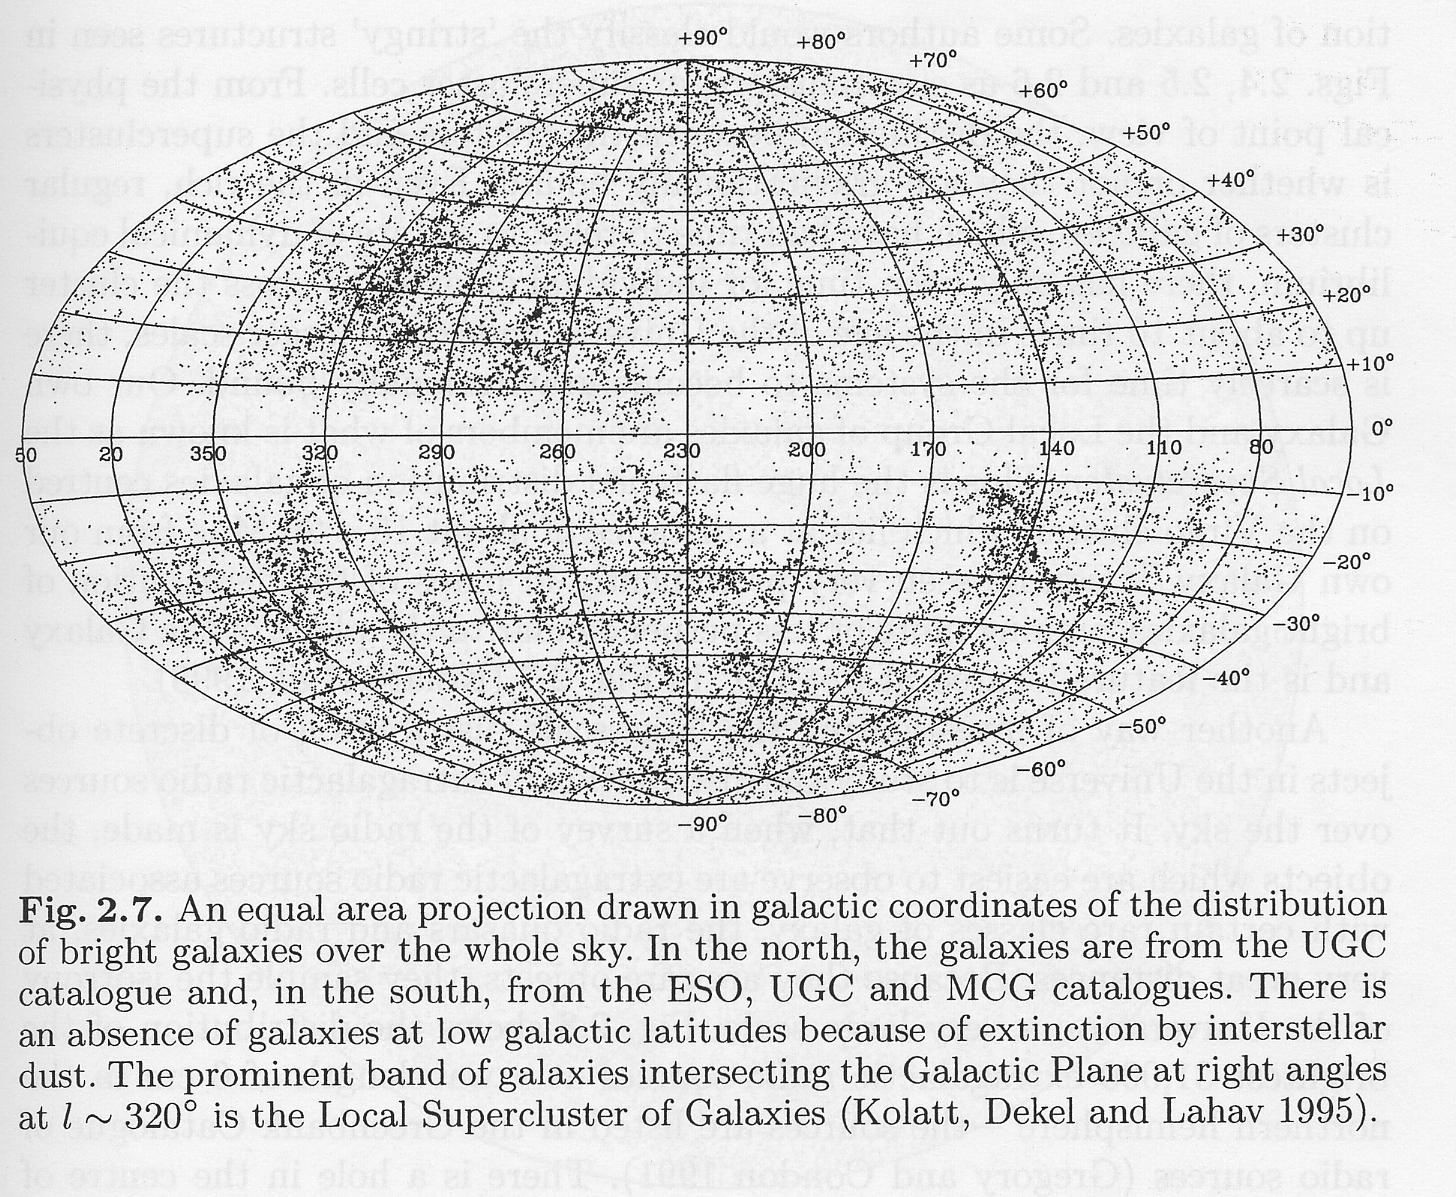
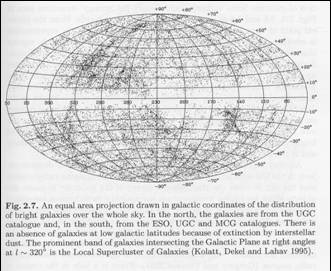
- Galaxy distributions seen in images are 2-d projections on the sky.
- Need distances…easiest way is to use the Hubble flow and
redshifts, either photometric or spectra (best).
- Reminder – SDSS and 2dF rule here now.
- Huchra and Gellar’s “Z-machine” for the CfA survey as
recounted in “Lonely Hearts of the Cosmos” by Dennis Overbye
– Great!
|
|
21
|
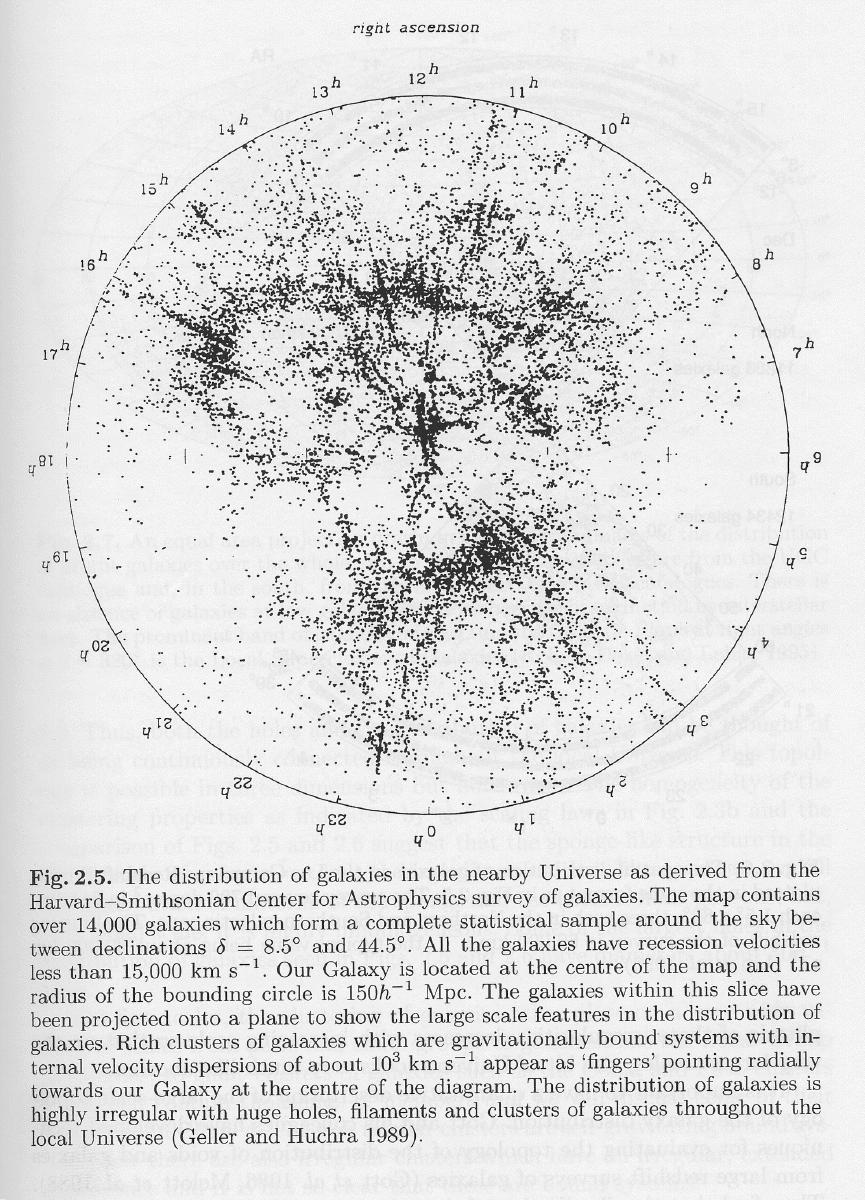
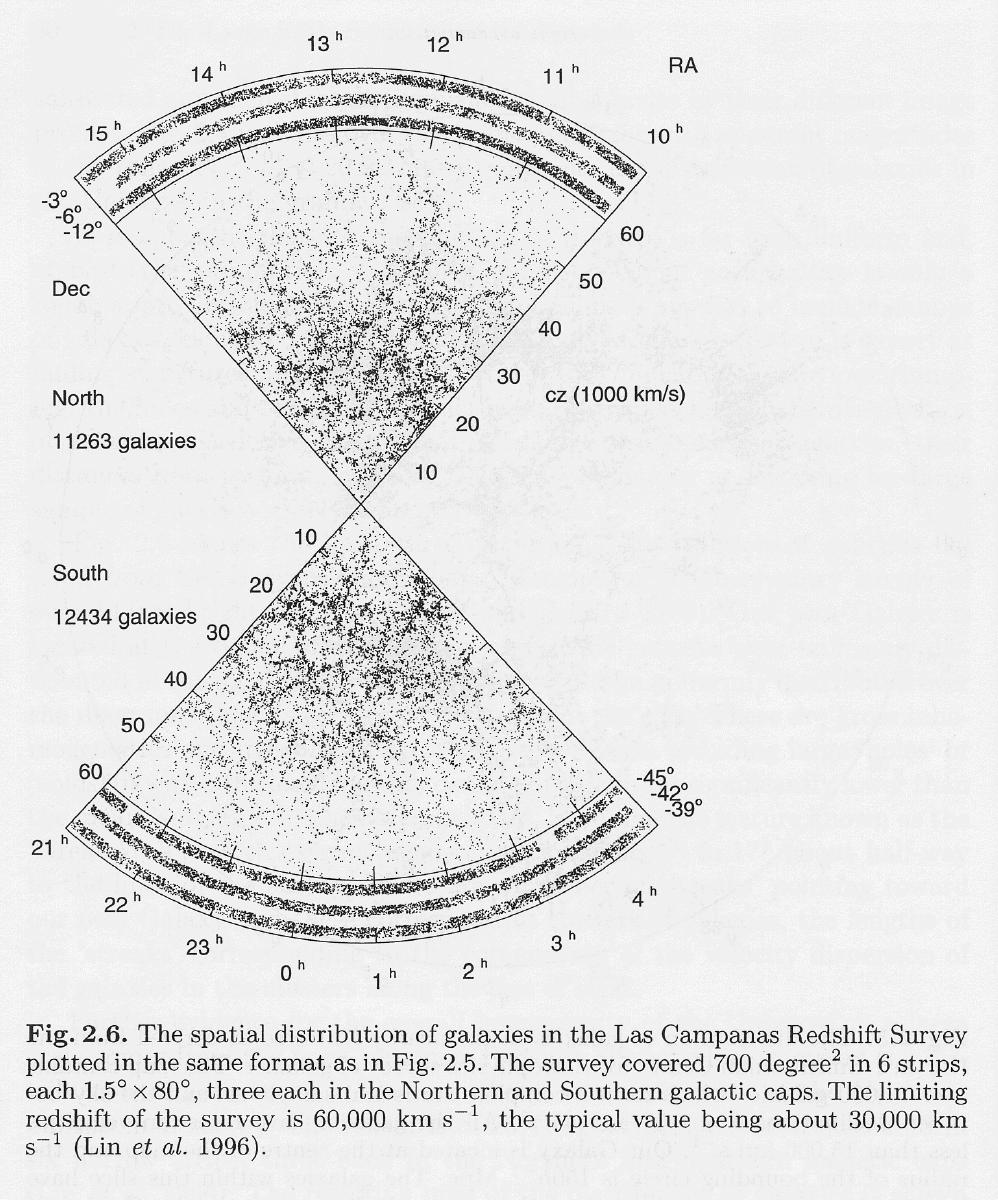
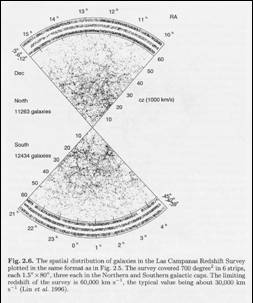
- Look at distance “slices” here.
|
|
22
|
- The famous “man” in the distribution. Shows walls, voids, etc.
- Why elongations, “finger of god” distributions pointing at
“us?”
|
|
23
|
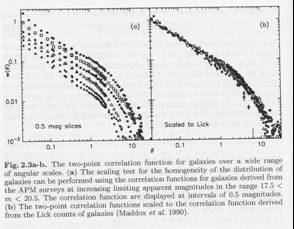
- Correlation functions
- How do you measure, quantitatively, the tendency of galaxies to
cluster?
- Following is specifically from Longair, but also present in Combes et
al. with a different presentation.
|
|
24
|
|
|
25
|
- On small scales, the universe is very inhomogeneous (stars,
galaxies). What about larger
scales?
- Angular two-point correlation function w(θ):
|
|
26
|
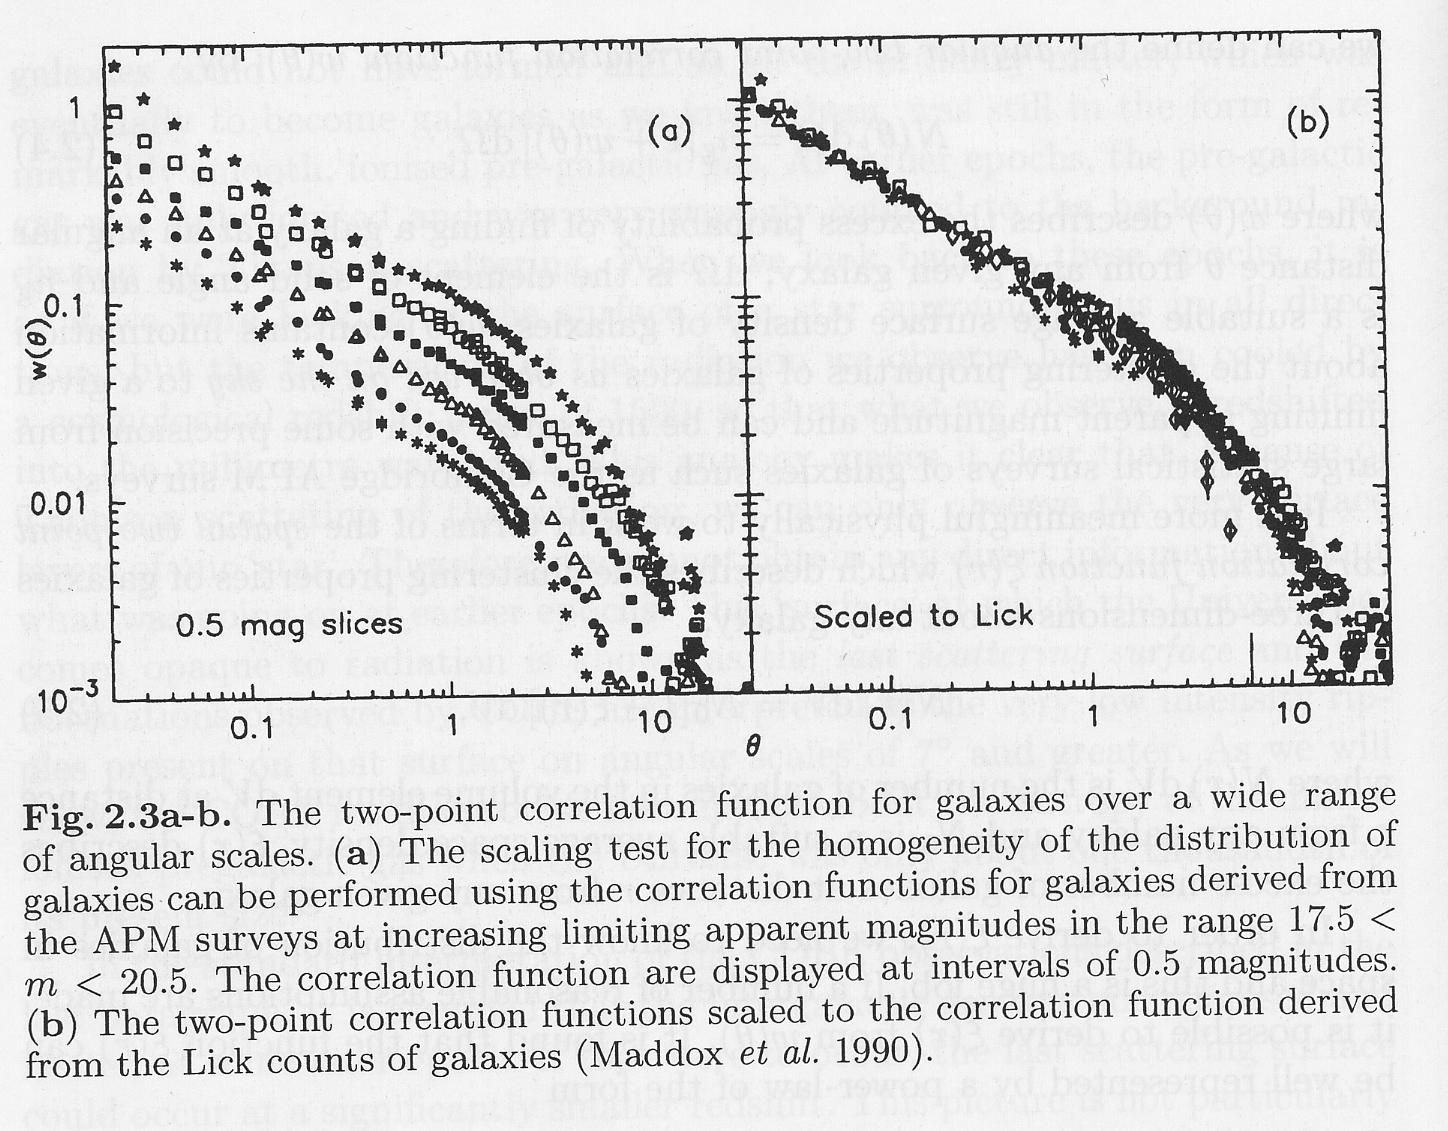
- This function w(θ) describes apparent clustering on the sky down to
some magnitude limit.
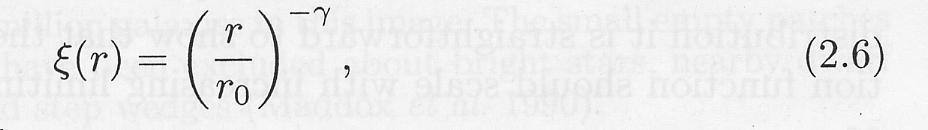
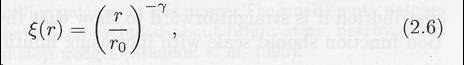
- More physically meaningful is the spatial two-point correlation function
ξ(r) which describes clustering in 3-D about a galaxy:
|
|
27
|
- w(θ) isn’t so hard to measure from various surveys –
just need positions.
- ξ(r) is harder –
must have redshifts to do properly.
Can make some assumptions however.
|
|
28
|
|
|
29
|
|
|
30
|
|
|
31
|
|
|
32
|
|
|
33
|
|
|
34
|
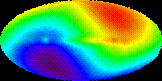
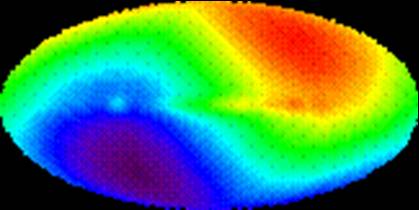
- Milky Way motion vs. CMBR, a “dipole” with velocity of about
1000 km/s (from COBE)
|
|
35
|
|

 Notes
Notes